Supplementary material
S1. Data quality and missingness
Table S1 reports the quality flags and missingness counts used to define the common comparison sample. The counts are cell counts unless stated otherwise. A missing value is not a zero: route-missing cells are excluded from the common set, and cells without demographic source support retain analytical nulls while their original exported zeros remain in the raw columns.
| Item | Count | Meaning |
|---|---|---|
| LST / NDVI missing | 0 | All master cells have delivered thermal and vegetation values |
| Population missing | 6 | No valid WorldPop support; analytical null, raw zero preserved |
| Child / elderly missing | 6 | Same six cells; no age support |
| Park distance missing (baseline) | 226 | No route to a candidate park; excluded, not zero |
| Park distance missing (conservative) | 407 | Explicit node/connector restrictions applied |
| Grid snap to network m | 66 | QA flag; retained in baseline, removed in one sensitivity |
| Coverage of nominal cell | 65 | Partial coastal/boundary cells; retained and flagged |
| Population exactly zero | 0 | No supported zero-population cell in the common sample |
| Children + elderly of population | 0 | No age-population inconsistency flagged |
| LST valid area | 1 | JKT_R037_C062; excluded from all models |
| Grids excluded from common comparison | 229 | 8.28% of master grid |
| Common comparison sample | 2,536 | 91.72% of master grid |
| Spatial observations after island removal | 2,535 | JKT_R013_C019 is a Queen island |
S2. Scenario-family sensitivity at three budgets
Table S2 reports the minimum and maximum Jaccard overlap of the M4 top-priority set with the baseline at the 5%, 10% and 20% budgets. Values are from the eligibility-changing comparison; the fixed-anchor comparison is reported in the main text and in the artifact tables. A family with a single scenario has identical minimum and maximum.
| Family | 5% (127) | 10% (254) | 20% (508) | |||
|---|---|---|---|---|---|---|
| Min | Max | Min | Max | Min | Max | |
| Aggregation | 0.896 | 0.896 | 0.881 | 0.881 | 0.913 | 0.913 |
| Park threshold | 0.494 | 0.649 | 0.521 | 0.682 | 0.447 | 0.782 |
| Weights | 0.881 | 0.954 | 0.868 | 0.954 | 0.917 | 0.961 |
| QA exclusions | 0.969 | 0.984 | 0.969 | 0.996 | 0.975 | 0.994 |
| Missing park distance | 0.906 | 0.920 | 0.906 | 0.906 | 0.903 | 0.913 |
| Joint factorial (16) | 0.530 | 0.682 | 0.583 | 0.728 | 0.668 | 0.789 |
| Missing support | 1.000 | 1.000 | 1.000 | 1.000 | 1.000 | 1.000 |
| Normalisation | 0.728 | 0.841 | 0.734 | 0.814 | 0.725 | 0.814 |
| Population definition | 0.270 | 0.954 | 0.347 | 0.977 | 0.481 | 0.996 |
| Route policy | 0.419 | 1.000 | 0.420 | 1.000 | 0.528 | 1.000 |
| Thermal support | 1.000 | 1.000 | 1.000 | 1.000 | 0.992 | 1.000 |
| Land cover | 0.682 | 0.682 | 0.782 | 0.782 | 0.774 | 0.774 |
S3. City composition of the top deciles
Table S3 reports the number and share of top-decile cells by city for M1–M4, together with the modelled population in the M4 top decile. City assignment follows the majority-area city of each clipped grid cell; it is not a separate raster zonal total within administrative boundaries.
| City | M1 | M1 % | M2 | M3 | M4 | M4 % | M4 population |
|---|---|---|---|---|---|---|---|
| West Jakarta | 39 | 15.4 | 60 | 62 | 63 | 24.8 | 389,483 |
| Central Jakarta | 2 | 0.8 | 14 | 25 | 17 | 6.7 | 124,689 |
| South Jakarta | 48 | 18.9 | 31 | 27 | 32 | 12.6 | 172,959 |
| East Jakarta | 88 | 34.6 | 62 | 73 | 87 | 34.3 | 526,819 |
| North Jakarta | 77 | 30.3 | 87 | 67 | 55 | 21.7 | 325,841 |
| Total | 254 | 100.0 | 254 | 254 | 254 | 100.0 | 1,539,791 |
S4. Alternative LISA summaries
Table S4 reports cluster counts for each model under the historical directed/999/BH configuration, retained for comparison. Table S5 repeats the M4 convention sensitivity from the main text; the adopted two-sided/9,999/BH specification is the first row. The counts are labels, not causal findings; the same map can yield different counts under a different tail, permutation count or correction. The per-cell primary labels are in Supplementary_Tables/lisa_m4_primary.csv.
| Model | HH | LL | HL | LH | ns |
|---|---|---|---|---|---|
| M1 | 433 | 360 | 12 | 13 | 1,717 |
| M2 | 437 | 375 | 16 | 9 | 1,698 |
| M3 | 442 | 324 | 11 | 5 | 1,753 |
| M4 | 319 | 323 | 11 | 10 | 1,872 |
| Tail | Permutations | Correction | Significant | Changed |
|---|---|---|---|---|
| Two-sided | 9,999 | BH | 493 | 0 |
| Two-sided | 999 | BH | 496 | 65 |
| Directed | 999 | BH | 663 | 170 |
| Directed | 9,999 | BH | 687 | 194 |
| Two-sided | 9,999 | BY | 234 | 259 |
| Directed | 9,999 | BY | 284 | 209 |
| Directed | 999 | BY | 0 | 493 |
S5. Exclusion geography and score distributions
Figure S1 maps the 229 excluded cells by primary exclusion reason. Reasons overlap: a cell may be route-missing and also lack demographic support. The primary reason is shown in the order low LST, population, age, route. The route-missing category therefore contains most of the age-unsupported cells that are also unroutable. Figure S2 shows the score distributions across the common sample. Figure S3 shows the candidate-park inventory by evidence state and the route-missing grid.
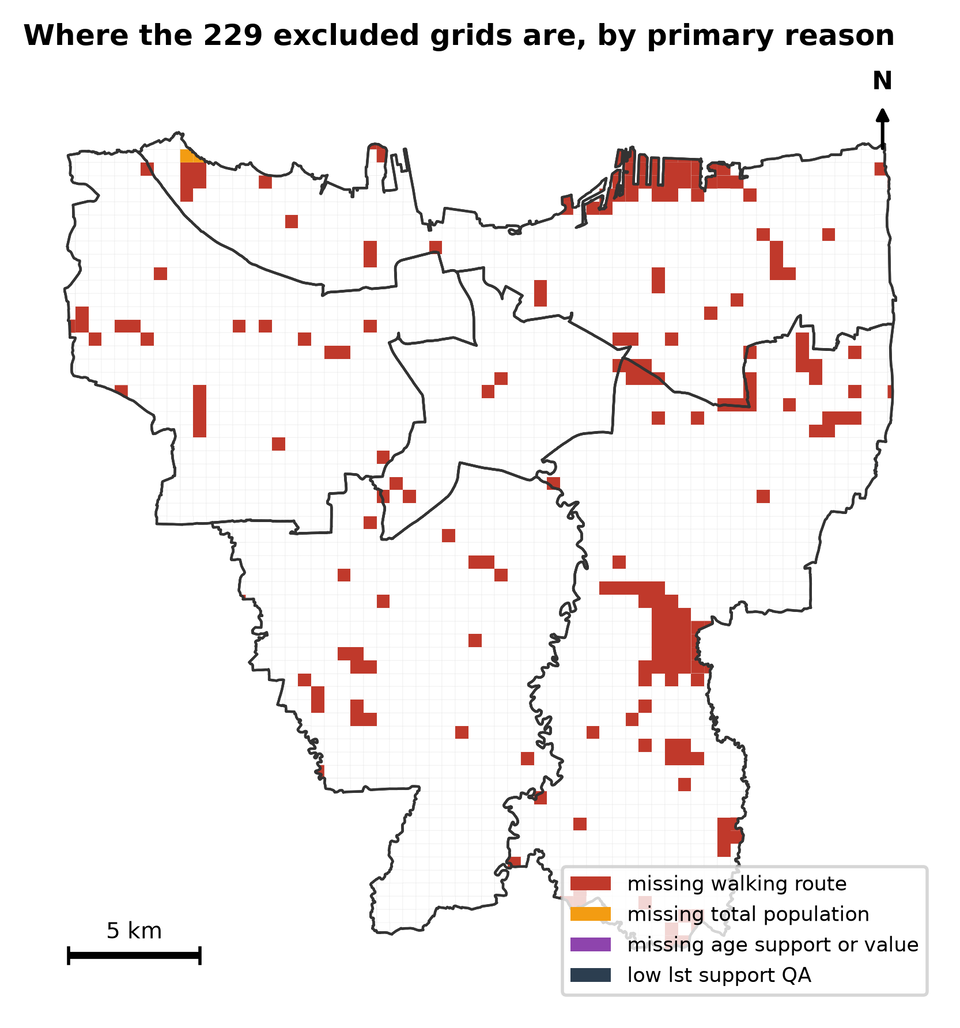
eligibility_by_model.csv and the 500 m grid.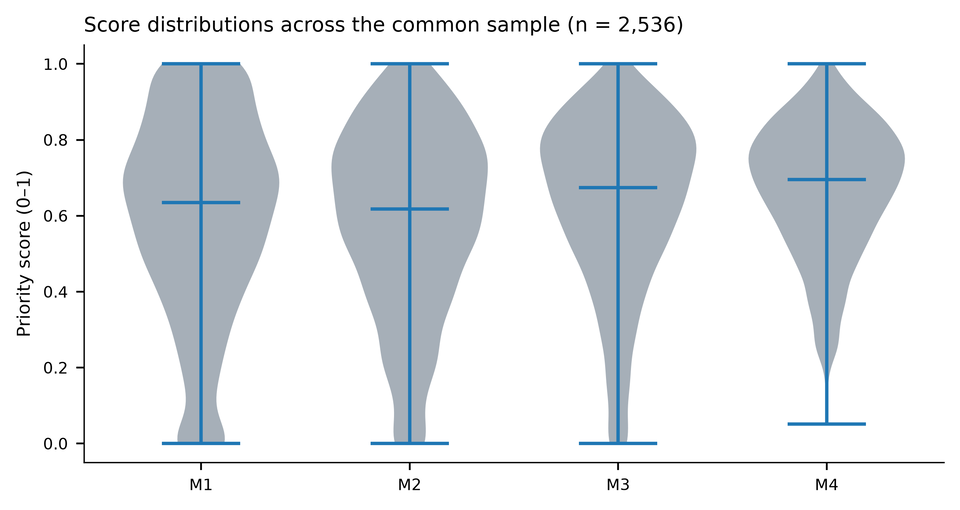
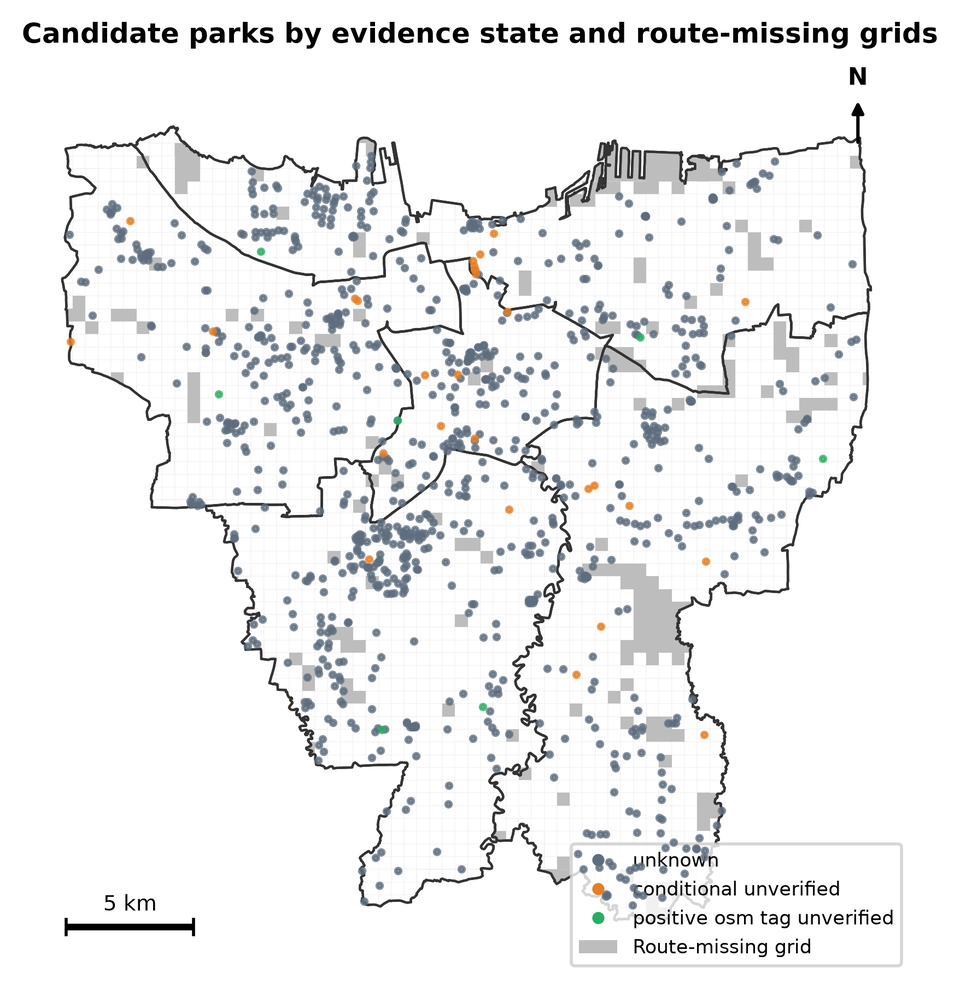
S6. Full scenario results
Table S6 lists all 49 executed scenario top-decile comparisons at the 10% budget. Jaccard and shared cells are relative to the M4 top-254 set. The machine-readable table is Supplementary_Tables/full_scenario_results.csv. The three registry entries that are baselines, duplicates or could not be executed are not presented as separate scenarios; the family summary is in S2.
| Family | Scenario | Jaccard | Shared/254 |
|---|---|---|---|
| Aggregation | Uniform fractional allocation | 0.881 | 238 |
| Park threshold | Binary park threshold 1,000 m | 0.521 | 174 |
| Park threshold | Binary park threshold 500 m | 0.530 | 176 |
| Park threshold | Park-deficit cap 1,500 m | 0.655 | 201 |
| Park threshold | Park-deficit cap 750 m | 0.682 | 206 |
| Weights | Equal weights | 0.868 | 236 |
| Weights | LST weight x0.8 | 0.917 | 243 |
| Weights | LST weight x1.2 | 0.917 | 243 |
| Weights | NDVI-deficit weight x0.8 | 0.939 | 246 |
| Weights | NDVI-deficit weight x1.2 | 0.903 | 241 |
| Weights | Park-deficit weight x0.8 | 0.881 | 238 |
| Weights | Park-deficit weight x1.2 | 0.924 | 244 |
| Weights | Vulnerable-count weight x0.8 | 0.946 | 247 |
| Weights | Vulnerable-count weight x1.2 | 0.954 | 248 |
| QA exclusion | Exclude coverage 10% | 0.969 | 248 |
| QA exclusion | Exclude remote-sensing QA failures | 0.996 | 253 |
| QA exclusion | Exclude snap 250 m | 0.973 | 248 |
| Missing park distance | Missing distance = maximum deficit | 0.906 | 252 |
| Missing park distance | Missing distance = observed median | 0.906 | 252 |
| Joint factorial | Total population, cap 1,500 m, clipped, fractional | 0.649 | 200 |
| Joint factorial | Total population, cap 1,500 m, clipped, hybrid | 0.655 | 201 |
| Joint factorial | Total population, cap 1,500 m, rank, fractional | 0.710 | 211 |
| Joint factorial | Total population, cap 1,500 m, rank, hybrid | 0.728 | 214 |
| Joint factorial | Total population, cap 750 m, clipped, fractional | 0.682 | 206 |
| Joint factorial | Total population, cap 750 m, clipped, hybrid | 0.677 | 205 |
| Joint factorial | Total population, cap 750 m, rank, fractional | 0.608 | 192 |
| Joint factorial | Total population, cap 750 m, rank, hybrid | 0.583 | 187 |
| Joint factorial | Vulnerable count, cap 1,500 m, clipped, fractional | 0.649 | 200 |
| Joint factorial | Vulnerable count, cap 1,500 m, clipped, hybrid | 0.655 | 201 |
| Joint factorial | Vulnerable count, cap 1,500 m, rank, fractional | 0.710 | 211 |
| Joint factorial | Vulnerable count, cap 1,500 m, rank, hybrid | 0.722 | 213 |
| Joint factorial | Vulnerable count, cap 750 m, clipped, fractional | 0.677 | 205 |
| Joint factorial | Vulnerable count, cap 750 m, clipped, hybrid | 0.682 | 206 |
| Joint factorial | Vulnerable count, cap 750 m, rank, fractional | 0.613 | 193 |
| Joint factorial | Vulnerable count, cap 750 m, rank, hybrid | 0.592 | 189 |
| Missing support | Corrected demographic support | 1.000 | 254 |
| Normalisation | 1st-99th percentile normalisation | 0.814 | 228 |
| Normalisation | Percentile-rank normalisation | 0.782 | 223 |
| Normalisation | Pure min-max normalisation | 0.734 | 215 |
| Population definition | Total population (not vulnerable count) | 0.977 | 251 |
| Population definition | Vulnerable share (not count) | 0.347 | 131 |
| Route policy | Route policy: baseline | 1.000 | 254 |
| Route policy | Route policy: conservative nodes | 0.842 | 224 |
| Route policy | Route policy: conservative nodes + connectors | 0.842 | 224 |
| Route policy | Route policy: full extent | 1.000 | 254 |
| Route policy | Route policy: positive tags | 0.420 | 150 |
| Thermal support | Thermal support 25% | 1.000 | 254 |
| Thermal support | Thermal support 50% | 1.000 | 254 |
| Land cover | Tree-probability land cover (NDVI replacement) | 0.782 | 223 |
S7. Demographic source support
Table S7 lists the six cells that remain without total-population and age-raster support after the buffered-age remediation. The machine-readable table is Supplementary_Tables/demographic_no_support.csv. Analytical values are null; raw exported zeros are retained in the *_raw fields and are not treated as estimated population.
| Grid ID | City | Area (km) | Coverage | Support state |
|---|---|---|---|---|
| JKT_R003_C031 | Selatan | 0.000266 | 0.0011 | no source support |
| JKT_R057_C063 | Utara | 0.002643 | 0.0106 | no source support |
| JKT_R061_C009 | Utara | 0.244458 | 0.9778 | no source support |
| JKT_R061_C010 | Utara | 0.098687 | 0.3947 | no source support |
| JKT_R061_C011 | Utara | 0.001981 | 0.0079 | no source support |
| JKT_R062_C043 | Utara | 0.006736 | 0.0269 | no source support |
All six cells have no_source_support for total population and both age groups. Their raw exported zeros are preserved in the *_raw fields; analytical values are null. The six cells are excluded from the M4 common comparison. JKT_R050_C061 is a different case: a supported near-zero estimate, not a no-support cell.
S8. Eligibility reconciliation
Table S8 reconciles the 2,765 master cells with the 2,538-cell benchmark and the 2,536-cell common set. The machine-readable table is Supplementary_Tables/eligibility_reconciliation.csv.
| Category | Cells | Note |
|---|---|---|
| Master grid cells | 2765 | Five mainland cities; 500 m lattice |
| Route-only missing | 222 | No path to a candidate park in baseline graph |
| Route + population + age missing | 4 | Already outside common set because of route |
| Population/age missing only | 2 | JKT_R003_C031; JKT_R057_C063 |
| Low LST support | 1 | JKT_R037_C062; 27.759% valid LST area |
| Excluded union | 229 | 8.28% of master grid |
| Benchmark common set | 2538 | 2,765 - 222 - 4 - 1 |
| Common set (2,536) | 2536 | 2,538 - 2 population-only slivers |
| Spatial observations after island | 2535 | JKT_R013_C019 is a Queen island |
S9. Figure and table provenance
| Item | Source | Note |
|---|---|---|
| Main Fig. 1 | merged_grid.csv, priority_models.csv, grid_500m_jakarta.gpkg | Generated from processed analysis tables |
| Main Fig. 2 | Same as Fig. 1 | Population and park distance |
| Main Fig. 3 | Same as Fig. 1 | M1/M4 top flags |
| Main Fig. 4 | Same as Fig. 1 | Rank displacement |
| Main Fig. 5 | rank_change_attribution.csv, robustness_family_summary.csv | Attribution and family envelope |
| Main Fig. 6 | lisa_m4_primary.csv, lisa_tail_permutation_sensitivity.csv | LISA map and counts |
| Tables 1–11 | Processed analysis tables listed in the main text | Values checked against the analysis dataset |
| S1 | data_quality.csv, demographic_support.csv | Quality and missingness |
| S2 | robustness_family_summary.csv | Three budgets |
| S3 | kota_summary.csv | City composition |
| S4–S5 | lisa_cluster_counts.csv, lisa_tail_permutation_sensitivity.csv, lisa_m4_primary.csv | LISA counts and primary per-cell labels |
| S6 | Supplementary_Tables/full_scenario_results.csv | 49 executed scenario comparisons |
| S7 | Supplementary_Tables/demographic_no_support.csv | Six unsupported demographic cells |
| S8 | Supplementary_Tables/eligibility_reconciliation.csv | Master-to-common eligibility |
| S9 | This file | Provenance register |
Author Contributions
All authors contributed to the preparation and critical revision of the manuscript. All authors reviewed and approved the final version and accept responsibility for its content.
Funding
This research received no external funding.
Conflicts of Interest
The authors declare no competing interests.
Use of AI-Assisted Tools
AI-assisted tools were used for language editing, LaTeX production and consistency checking during the preparation of this manuscript. The authors reviewed and approved all scientific content and accept responsibility for the final article.
License
Copyright © 2026 The Authors. This work is licensed under a Creative Commons Attribution 4.0 International License (CC BY 4.0, https://creativecommons.org/licenses/by/4.0/). The licence applies to the author-created supplementary narrative, tables and original figures. Third-party datasets, software and the LaTeX template remain under their own licences and attribution requirements; the template source remains under GPL-3.0-or-later.
How to cite
APA
Faqih, M. F., Mustofa, M. A., & Abdulloh, M. (2026). From thermal hotspots to spatial priorities: Attribution and sensitivity of urban heat screening in Jakarta [Preprint, version 1; not peer-reviewed]. Renaro Lab.
BibTeX
@misc{faqih2026from,
  title  = {From Thermal Hotspots to Spatial Priorities: Attribution and Sensitivity of Urban Heat Screening in Jakarta},
  author = {Faqih, Muhammad Fariq and Mustofa, Muhammad Alim and Abdulloh, Mu’adz},
  year   = {2026},
  note   = {Preprint, version 1. Not peer-reviewed.},
  doi    = {10.5281/zenodo.24414265},
  url    = {https://renaro.my.id/publications/jakarta-heat-priorities}
}
Licence: CC BY 4.0. Third-party data and software keep their own licences.